Building a Carbon Sequestration Fiscal Model using Bayesian Networks
The article introduces the Carbon Sequestration Economic Graphical Model (CSEGM), a novel approach for modeling the economics of carbon capture and storage (CCS) projects using Probabilistic Graphical Models (PGM). It outlines a comprehensive fiscal model that integrates key financial components such as revenues, expenses, royalties, and taxes. The model, developed using TKRISK® software, diverges from traditional deterministic models by incorporating uncertainties inherent in the CCS fiscal environment. The article emphasizes the use of Bayesian networks for sensitivity analysis and uncertainty quantification, highlighting their effectiveness in modeling fiscal dependencies and variabilities. It contributes to informed decision-making in CCS projects.
The economic feasibility of carbon capture and storage (CCS) projects, critical to climate change mitigation, is profoundly influenced by complex fiscal dynamics. This paper introduces a novel fiscal modeling approach for CCS projects in the United States, utilizing Probabilistic Graphical Models (PGM). Using TKRISK® software, we develop a comprehensive model that integrates key financial components such as revenues, operating and capital expenditures, royalties, and taxes. Our approach diverges from traditional deterministic models by embracing the inherent uncertainties of the fiscal environment within which CCS operates.
The article highlights the suitability of probabilistic graphical models in financial forecasting for CCS, offering new insights into cash flow and risk management under uncertain subsurface, regulatory, and market pricing conditions. Our findings contribute to more informed decision making in the planning of CCS projects, underscoring the critical interplay between economic viability and environmental sustainability.
CCS economic models typically account for different cost factors, including capital expenditures (CAPEX), operating expenditures (OPEX), and abandoment expenditures (ABEX). They also include revenue streams from regulatory incentives, such as 45Q tax credits, LCFS credits, and cap-and-trade allowances. While much has been said about the cost of CCS ([7], [5], [6]), we recognize that few economic models provide the flexibility required to model the various revenue streams necessary for the scaling of this technology in an ever evolving regulatory environment. [2] presents such a model and explores the feasibility of converting a depleted, yet producing, oil and gas field in California for carbon sequestration. This example illustrates a sequestration scenario with multiple income streams and income losses incurred during the reservoir conversion process to sequestration to illustrate applicability for simpler use cases. This article proposes to build a model that follows the operator's perspective when approaching an investment decision under uncertainties.
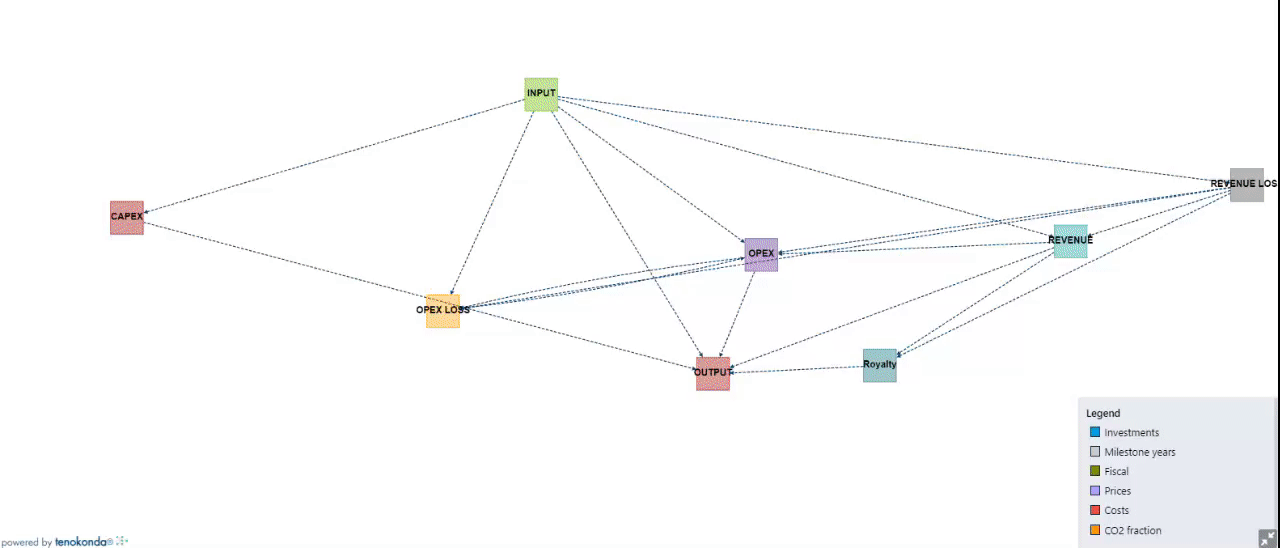
We build the CCS fiscal model as a PGM. PGMs([1]) are a class of statistical models that represent conditional dependencies between variables using a graphical structure that allows reasoning and inference under uncertainty. Cashflow models are well suited for such representations as they typically involve directional streams (of cash and others) that can be traced as the edges of the graph, while the nodes represent transformations where fiscal rules such as royalties, tax or contract terms can be implemented. The two main advantages of using PGMs over the usual alternatives (spreadsheets, scripted code) are as follows.
Ease of use: The graph is a visual and intuitive interpretation of the model. Users can access any of the intermediate nodes (variables) which offers the possibility to deep dive into the rules or perform sensitivities
Scalability: The probabilistic nature of the graph means that once built deterministically, it can flawlessly transition to uncertainty analysis mode by performing joint stochastic simulation of any group of nodes. These models when run probabilitically can outperform alternatives by orders of magnitudes ([3])
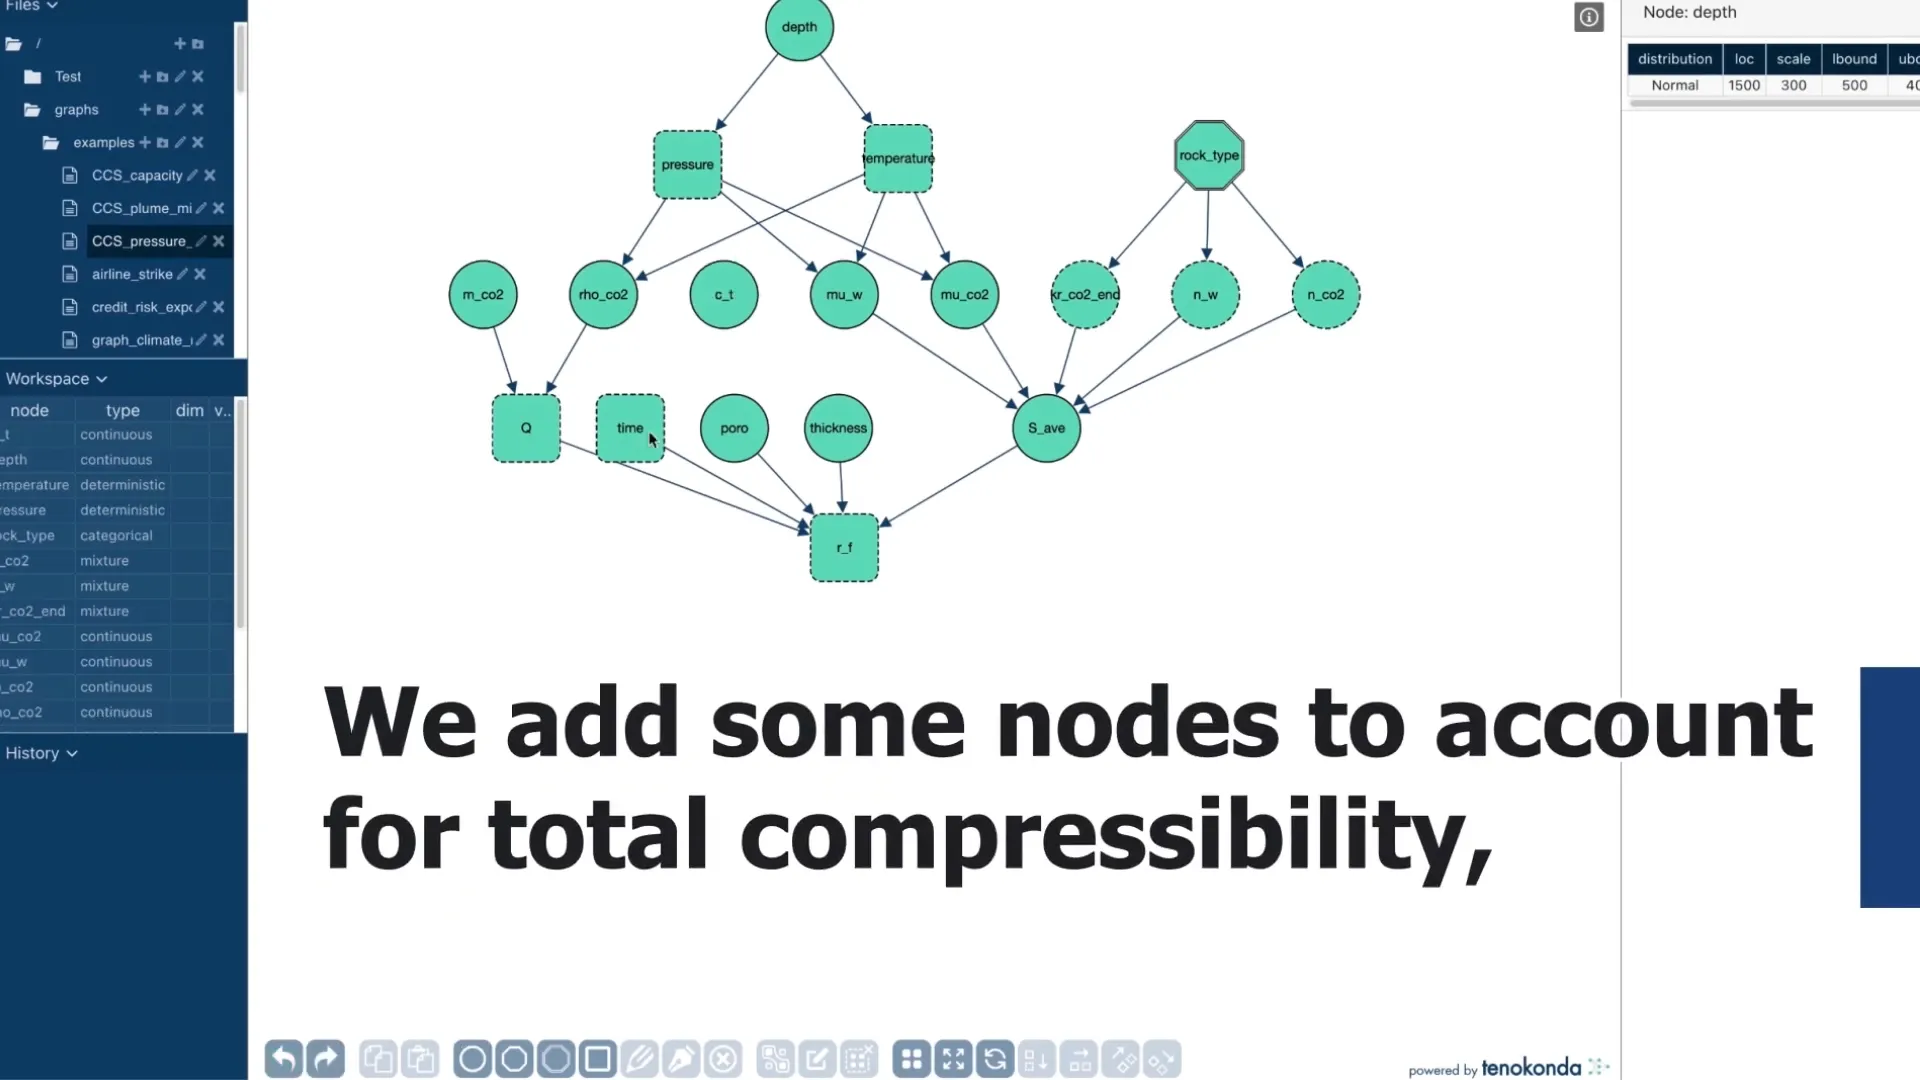
TKRISK® (www.tenokononda.com) is a Bayesian network framework that can be used to build risk models. The graph-based CCS economic model (CSEGM) is thought of and built as a risk model. Figure [1] shows a graphical representation of the model.
The nodes presented in Figure [1] are actually collapsed groups. A more detailed view of the model will be addressed in a subsequent article.
Once the model is built, we can use it for various purposes. We illustrate this with a few examples.
We consider a synthetic project that would be representative of a CCS project using capture from an emitter's source and storage in a depleted oilfield in California. Several of California's operators produce heavy-oil fields that require the use of steam to make the oil more mobile. Steam is typically generated from the combustion of natural gas, increasing the carbon intensity of the oil produced. The capture of could be used in steam generators or oilfield co-generator gas plants to lower carbon emissions. Other sources of ethanol, cement, electrical or other industrial processes are possible but could require more transportation infrastructures. The properties of the project are listed in Table [1].
| Property | Value |
|---|---|
| Location | Onshore |
| Reservoir | Depleted Oil-Gas |
| injection rate | 1,000 t/d/injector |
| Reservoir Depth | 2600-2700 ft |
| Reservoir Temperature | 87F |
| Number of legacy wells (P&A) | Variable (known) |
| LCFS price | 75/tonne |
The cash flow profile is generated using the model built using TKRISK®. We present a breakdown of the various components of revenue and losses and aggregate them into an after-tax cash flow curve as seen in Figure [2]
As of the 2022 Inflation Reduction Act ([4]), 45Q federal tax credits are 85/t for Non-Enhanced Oil Recovery projects and last 12 years. This explains the loss of revenues during the project and highlights the importance of credit in incentivizing such projects. The fiscal model can be used to estimate the economic impact of various incentives on projects' metrics and, therefore, their likelihood of being pursued. As such, such models can be great tools in the process of evaluating alternative incentives and incentives time frames, like if the 45Q period was extended beyond 12 years.
Based on the cash flow curve presented in Figure [2], we can calculate some key economic metrics such as net present value (NPV), discounted profitability index (DPI), rate of return (RoR) or pay-out years. These are presented in Table [2]
| NPV | PI | Payout | RoR |
|---|---|---|---|
| 463 MM | 1.6 | 8.7 yrs | 24.8 % |
These economics look very favorable for the project under consideration. Let us evaluate how sensitive these results are to some of the input hypotheses we made.
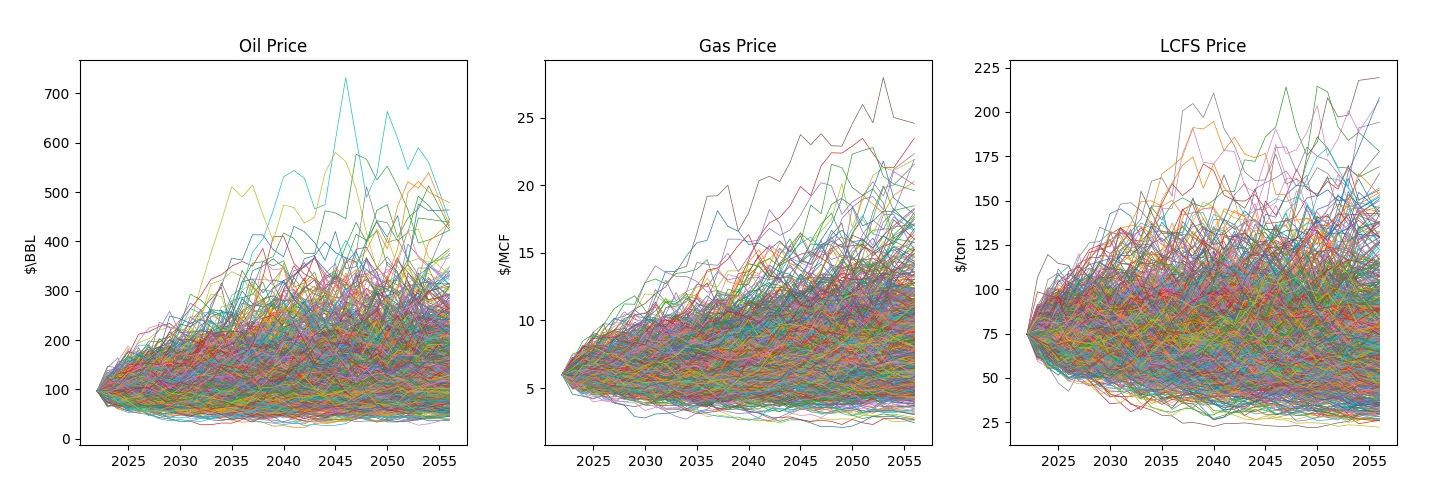
PGM allow both model uncertainties and to evaluate associated risks. This can be used in a decision quality framework. Taking into account the importance of the price of LCFS and the wide uncertainty associated with it. We decide to simulate the impact of prices on the economics of the project. For this, we make a few assumptions on the evolution of LCFS. We explore the hypothesis that carbon prices have historically been correlated with prices of commodities such as Oil or Gas. One of the main interests of PGM simulation is that we can simulate these variables jointly. A detailed analysis of these effects will be presented in a subsequent post.
The results of 1000 stochastic simulations of the three joint prices are presented in Figure[3].
The PGM model naturally allows for the joint simulation of these three input variables and leads to distributions of the main metrics presented in the previous section. These distributions are presented in Figure [4]
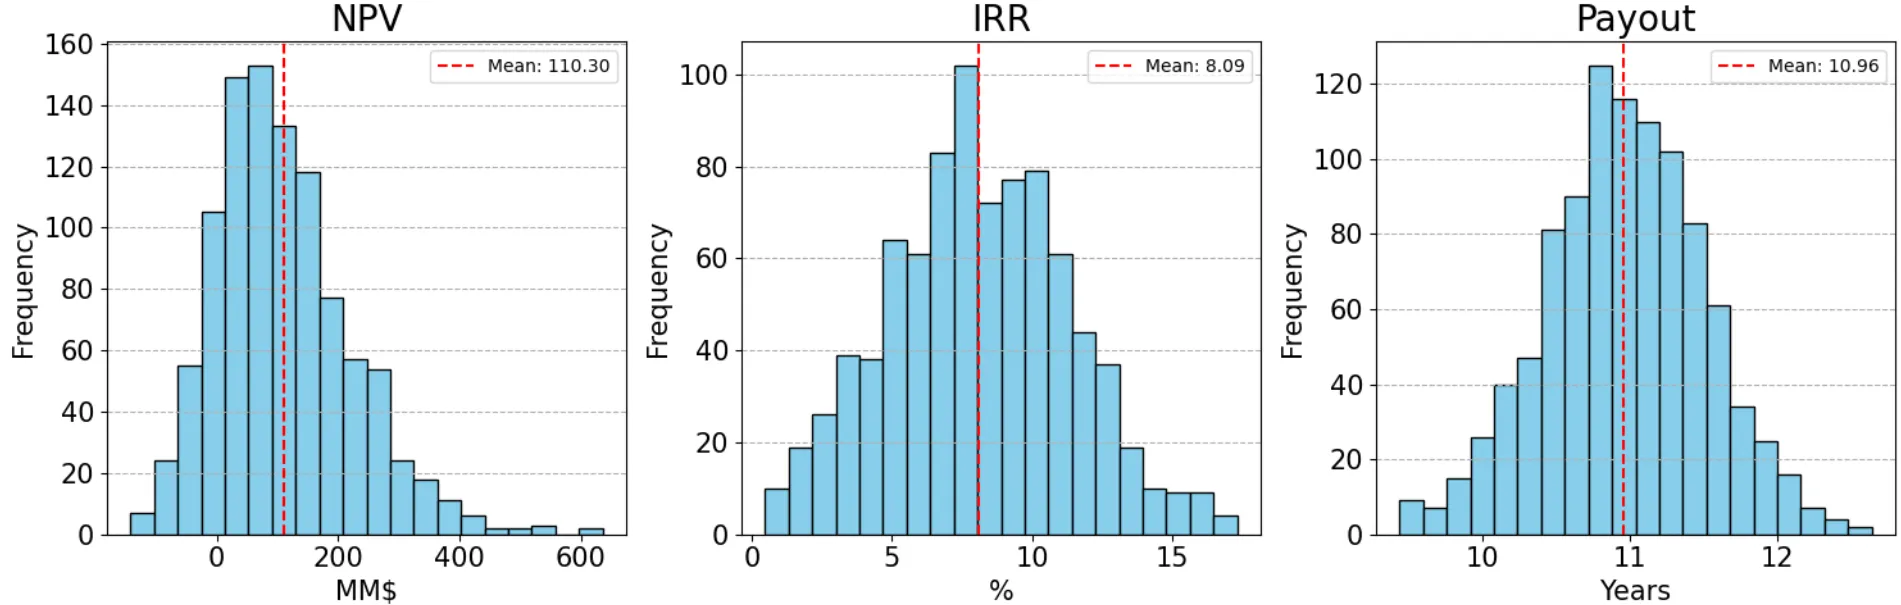
We see that while the deterministic project showed very favorable economics, the probabilistic assessment presented in Figure[5] paints a more nuanced picture. It shows that there is a non-negligible chance (about 13.7%) that the project will have negative NPV. This is due to the deterministic LCFS price scenario (chosen to oscillate around 75/ton. The distributions reflect a more current evaluation of prices, while maintaining coherence in the joint evaluation of input prices. This approach opens the door to the test of specific scenarios related to macroeconomic trends or policy changes in relation to climate targets.
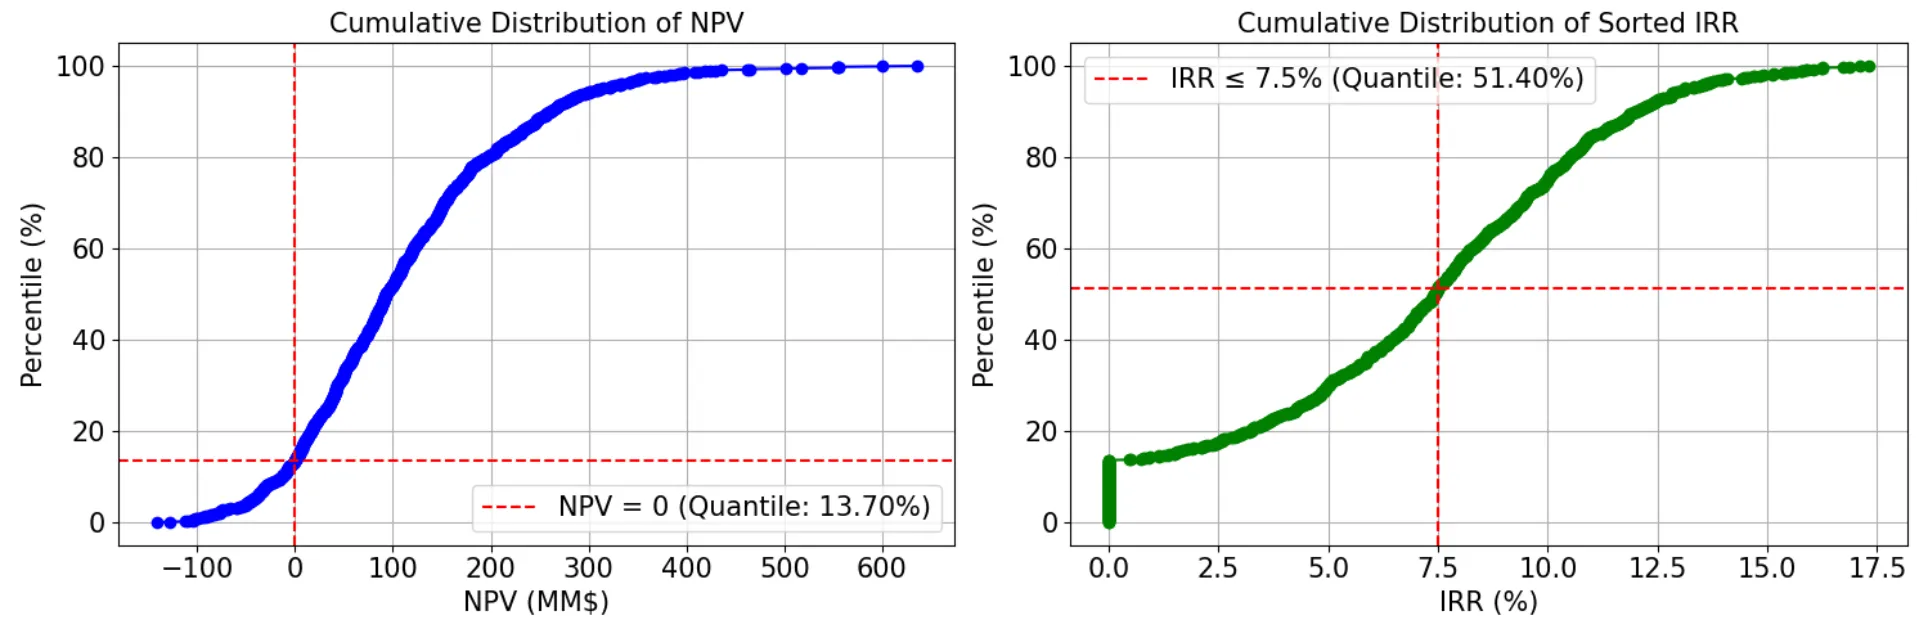
Figure[5] also shows that the probabilistic view of the IRR is such that about 51.4% of the scenarios are expected to have an IRR lower than 7.5% which has been retained as one of the hypothetical decision criteria that can be used to sanction and move the project forward.
The Carbon Sequestration Economic Graphical Model (CSEGM) is an innovative approach to model the economics of carbon capture and storage (CCS) projects using Probabilistic Graphical Models (PGM). This article provides an overview of the methodology used to develop the CSEGM, including the simple representation of complex fiscal dynamics that influence the economic feasibility of CCS projects. CSEGM is built for uncertainty using PGMs. We illustrate this with a joint simulation of prices variability that have a direct impact on the revenue stream of the project. Several key economic metrics, such as net present value (NPV), profitability index (PI), rate of return (RoR), and payout years, are calculated based on the cash flow profiles generated both deterministically and probabilistically. These metrics provide a comprehensive assessment of the economic viability of the project. In conclusion, CSEGM offers a robust and scalable framework for the modeling of CCS economics around the world. Although we present the example of a depleted oilfield in California, the approach can invariably be expanded to any type of project, in any regulatory environment for a very large number of scenarios at the time. This tool could be adopted by industrial stakeholders, economists, and regulators to develop a comprehensive view of the potential risks and rewards associated with carbon capture and storage initiatives.