Bayesian Network Representation of Joint Normal Distributions - Cascading Regressions Model

Denis Papaioannou
March 7, 2022

This post is the first of a series discussing the Bayesian Network representation of multivariate normal distributions. A joint normal distribution being fully specified by its mean vector and its covariance matrix is not simple to interact with as its Bayesian network equivalent. Representing a joint normal distribution as a Bayesian network enables visualizing and interacting with the distribution through the lens of probabilistic graphical models with TKRISK®.

We demonstrate in this post a simple yet powerful approach using a cascading regressions approach.

Introduction

A normal distribution N(m,v)\mathcal{N}(m, v) is fully specified using two parameters: its mean mRm\in\mathbb R and its variance vR+v\in\mathbb R_+. Likewise, a nn-dimensional multivariate normal distribution N(M,V)\mathcal{N}(M, V) is fully specified by its mean vector MRnM\in\mathbb R^n and covariance matrix VRn×RnV\in\mathbb R^n\times \mathbb R^n.

The latter can also be represented as a Bayesian Network, more specifically as a Gaussian Bayesian network [KF09] [CBLV20].

Theoretical Results

In what follows we will be working with a vector of random variables X=(X1,...,Xn)X=(X_1,..., X_n) following a multivariate normal distribution N(M,V)\mathcal{N}(M, V).

By definition M=(E[Xi])i1,nM = (\mathbb E[X_i])_{i \in \llbracket 1, n\rrbracket} and V=(cov(Xi,Xj))(i,j)1,n2V = (cov(X_i, X_j))_{(i,j) \in \llbracket 1, n\rrbracket^2}.

Cascading Regressions Model
Mathematical Derivation

Through basic matrix operations we will show how N(M,V)\mathcal{N}(M, V) can be represented through a cascading regression model which is a particular case of a linear Gaussian Structural Equation Model (SEM) [DFS11][PK19], the latter having a direct Gaussian Bayesian Network equivalent.

Applying LDL decomposition on VV yields V=LDLTV = L D L^T with LL being unit lower triangular and DD diagonal.

Therefore:XMLEX - M\sim L E with EN(0,D)E\sim \mathcal{N}(0, D).

Introducing BIL1B \triangleq I - L^{-1} with II being the n-dimensional identity matrix, we obtain the structural model:X(IB)M+BX+EX \sim (I-B)M + BX + EThe above specifies a Gaussian Bayesian Network which can be expressed explicitly for each variable:i1,n,Xim~i+j=1i1bi,jXj+ei\forall i \in \llbracket 1, n\rrbracket, X_i \sim \tilde{m}_i + \sum_{j=1}^{i-1} b_{i,j}X_j + e_iwith:

  • m~i=mij=1i1bi,jmj\tilde{m}_i=m_i - \sum_{j=1}^{i-1} b_{i,j}m_j
  • E=(ei)1inE = (e_i)_{1\leq i \leq n}
  • B=[100b2,10bn,1bn,n11]B = \begin{bmatrix}1 & 0 & \cdots & 0 \\b_{2,1} & \ddots & \ddots & \vdots \\\vdots & \ddots & \ddots & 0\\b_{n,1} & \cdots & b_{n,n-1} & 1\\\end{bmatrix}

The terms of matrix B can be interpreted as the linear regression coefficients of each variable XiX_i over its parents Pa(Xi)={X1,...,Xi1}Pa(X_i) = \{X_1, ..., X_{i-1}\}.

It is important to note that a different order in the variables will lead to a different Bayesian Network structure, representing however the exact same joint distribution.

The above approach is simple, computationally efficient and allows Bayesian Networks generation straight from any dataset for which variables are assumed normally distributed. Working with LDL decomposition and requiring only unit lower triangular matrix inversion means the algorithm is flexible to handle any case of covariance matrix (even non definite) and thus any multivariate normal distribution.

Algorithm

procedure BUILD-GAUSSIAN-BAYESIAN-NETWORK-FROM-COVARIANCE(MM, VV)
Set G\mathcal{G} to an empty graph
L,DLDL(M,V)L, D \gets \textit{LDL}(M, V)
apply LDL decomposition
L1solve_triangular(L,I)L^{-1} \gets \textit{solve\_triangular}(L, I)
invert lower triangular matrix LL
M~(IB)M\tilde{M} \gets (I-B)M
calculate adjusted mean
for i=1i=1 to nn do
Add XiN(m~i,vi,i)X_i\sim \mathcal{N}(\tilde{m}_i, v_{i,i}) to G\mathcal{G}
initialize variable with the right marginal distribution
for j=1j=1 to i1i-1 do
add XiX_i's parents with the right coefficients
if li,j0l_{i,j} \neq 0 then
Add Xjundefinedli,jXiX_j \xrightarrow{-l_{i,j}} X_i to G\mathcal{G}
end if
end for
end for
return G\mathcal{G}
end procedure

Normalization

It is common to work on standardized normal distributions, i.e. with zero mean and unit variance:

  • M=0M=0
  • Diag(V)=[1,,1]\textit{Diag}(V) = [1, \cdots, 1]

In this case covariance and correlation matrices are one and the same. This is a convenient setup which does not imply loss of generality as non-normalized marginals can be recovered by shifting and scaling the normalized ones. Working on normalized space allows for direct comparison of dependencies between variables as these are independent of their actual magnitude.

For a self-contained graph representation, contrary to the above generic approach, the Gaussian Bayesian Network is insufficient and would require additional deterministic nodes to apply shifting and scaling (shifting and scaling directly a node on the Bayesian Network would propagate on its children and thus alter the joint distribution).

For sake of simplicity we will present examples on standardized normal distributions only.

Generic Examples

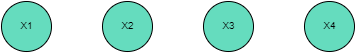
To visualize and interpret the above approach, we will take basic examples of 4 dimensional multivariate normal distributions.

Independent    Independent variables naturally translate to no connections between nodes, with the correlation matrix being the identity matrix.

V=[1000010000100001]V = \begin{bmatrix}1 & 0 & 0 & 0 \\0 & 1 & 0 & 0 \\0 & 0 & 1 & 0\\0 & 0 & 0 & 1\\\end{bmatrix}     \implies vcv2bn_rr_theoretical_independent/

Bayesian Network resulting from cascading regressions model.
Sparse    In this case X3X_3 is independent from all other variables, hence the lack of incoming and outgoing edges.
V=[10.1000.1100.5001000.501]V = \begin{bmatrix}1 & 0.1 & 0 & 0 \\0.1 & 1 & 0 & 0.5 \\0 & 0 & 1 & 0\\0 & 0.5 & 0 & 1\\\end{bmatrix}     \implies vcv2bn_rr_theoretical_sparse/

Bayesian Network resulting from cascading regressions model.
Dense    In the case where all variables are correlated to each other, the corresponding network is fully connected.
V=[10.10.20.30.110.40.50.20.410.60.30.50.61]V = \begin{bmatrix}1 & 0.1 & 0.2 & 0.3 \\0.1 & 1 & 0.4 & 0.5 \\0.2 & 0.4 & 1 & 0.6\\0.3 & 0.5 & 0.6 & 1\\\end{bmatrix}     \implies vcv2bn_rr_theoretical_dense/

Bayesian Network resulting from cascading regressions model.
References
[KF09]
Daphne Koller and Nir Friedman. Probabilistic Graphical Models: Principles and Techniques, pages 251-254. The MIT Press, second edition, 2009.
[CBLV20]
Irene Córdoba, Concha Bielza, Pedro Larragaña, Gherardo Varando. Sparse Cholesky Covariance Parametrization for Recovering Latent Structure in Ordered Data. IEEE, 2020.
[PK19]
Gunwoong Park, Youngwhan Kim. Identifiability of Gaussian Linear Structural Equation Models with Homogeneous and Heterogeneous Error Variances. Journal of the Korean Statistical Society, 2019.
[DFS11]
Mathias Drton, Rina Foygel, Seth Sullivant. Global Identifiability of Linear Structural Equation Models. The Annals of Statistics, 2011.
Tenokonda